LVN-03
Laveen · Phoenix, AZ 85339 · Single-family
- Asking
- $396,000
- Est. rent / mo
- $2,210
- Est. cap rate
- 3.65%
- Est. cash-on-cash
- -7.95%
- Est. DSCR
- 0.63
- Rent / price
- 0.558%
- $ / sq ft
- $222
- Est. cash flow / mo
- -$722
At the baseline set: 25% down, 6.75%, 30-year amortisation. Estimates.
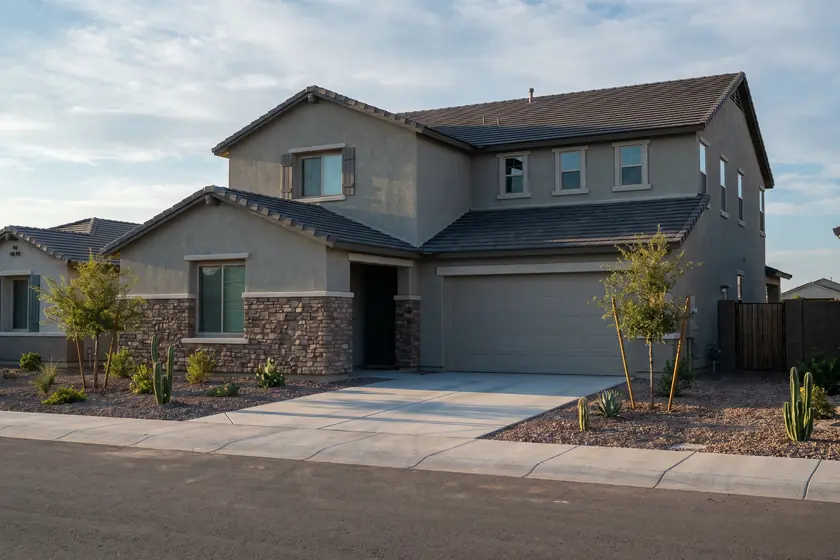
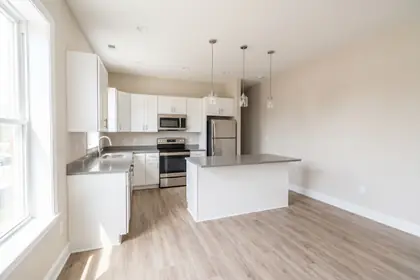
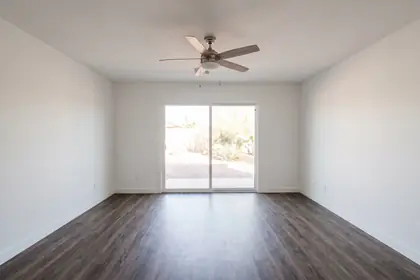
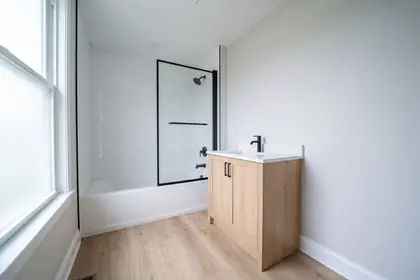
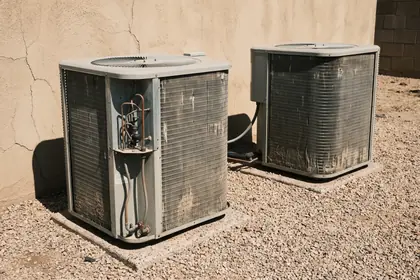
Representative stock photography of Phoenix-metro residential product. These are not photographs of this asset — there is no such asset. This panel publishes a code and a submarket and nothing finer, because a plausible house number on a real street is a real house, and putting an invented price under a photograph of one is the thing this whole demonstration exists to avoid.
The read
Standard Laveen tract product. Underwrites almost exactly at the submarket median on every line, which makes it a useful reference row for the rest of the panel.
- HOA $88/mo
- Open plan
- Paver patio
- Community park
Facts
| Property type | Single-family |
|---|---|
| Units | 1 |
| Bedrooms / bathrooms | 3 / 2 |
| Living area | 1,780 sq ft |
| Lot | 5,663 sq ft |
| Year built | 2012 (14 yrs) |
| Stories | 1 |
| Parking | 2-car garage |
| Panel code | LVN-03 |
| Location | Laveen, Phoenix 85339 |
| Property tax / yr | $2,300 |
|---|---|
| Insurance / yr | $1,770 |
| HOA / mo | $88 |
| Other fixed / yr | $360 |
| Total est. operating / yr | $10,472 |
| HVAC installed | 2012 |
| Roof installed | 2012 |
| Water provider | City of Phoenix |
| FEMA flood zone | Zone X |
Underwrite it
Every figure below recomputes as you move an input. Nothing is rounded until it is printed, and operating expenses never include debt service — that separation is what makes the cap rate a property of the building and the cash-on-cash a property of your deal. All outputs are estimates.
Monthly cash flow
−$722
after debt service, before tax
Cap rate
3.65%
NOI ÷ purchase price
Cash-on-cash
-7.95%
cash flow ÷ cash invested
DSCR
0.63
NOI ÷ annual debt service
Where the gross rent goes
- Vacancy$1,591
- Operating$10,472
- Debt service$23,116
- Cash flow$0
| Gross scheduled income | $26,520 |
|---|---|
| Less vacancy & credit loss | −$1,591 |
| Effective gross income | $24,929 |
| Less fixed operating | −$5,486 |
| Less variable operating | −$4,986 |
| Net operating income | $14,457 |
| Less annual debt service | −$23,116 |
| Pre-tax cash flow | -$8,659 |
| Loan amount | $297,000 |
| Monthly principal & interest | $1,926 |
| Cash invested | $108,900 |
| Operating expense ratio | 42.0% |
| Break-even occupancy | 126.7% |
| Gross rent multiplier | 14.9 |
| Rent-to-price ratio | 0.558% |
Estimated figures produced by a model from the assumptions on the left. Not an offer, an appraisal, a loan quote or investment advice. Taxes, insurance and operating expenses are estimates; verify each before you commit capital.
What it would have to cost
The asking price against three solved thresholds
Rent and every operating line held exactly as stated; only the purchase price moves. Each mark is the price that solves one condition. Nothing here is a price history: this asset has none, and inventing one would be the easiest dishonest thing on the page.
| Condition | Price | vs ask | What it means |
|---|---|---|---|
| Current asking price | $396,000 | — | The number on the panel. Everything below is measured against it. |
| DSCR 1.00 | $247,500 | −37.5% | net operating income exactly covers the mortgage; cash flow is zero |
| Submarket median cap (3.65%) | $396,000 | +0.0% | the price at which this asset yields what its submarket already yields |
| Leverage turns (5.84%) | $247,500 | −37.5% | above this cap rate the loan adds to the return instead of subtracting from it |
Asking price carried on the submarket index
The current asking price projected backwards on the Laveen median-price index. Arithmetic on two synthetic series — not an appraisal, not a price history and not a record of any transaction.
| Month | Index-adjusted ask |
|---|---|
| Oct 2024 | $375K |
| Nov 2024 | $376K |
| Dec 2024 | $378K |
| Jan 2025 | $381K |
| Feb 2025 | $383K |
| Mar 2025 | $385K |
| Apr 2025 | $384K |
| May 2025 | $382K |
| Jun 2025 | $379K |
| Jul 2025 | $378K |
| Aug 2025 | $378K |
| Sep 2025 | $381K |
| Oct 2025 | $385K |
| Nov 2025 | $388K |
| Dec 2025 | $389K |
| Jan 2026 | $389K |
| Feb 2026 | $387K |
| Mar 2026 | $385K |
| Apr 2026 | $385K |
| May 2026 | $386K |
| Jun 2026 | $390K |
| Jul 2026 | $393K |
| Aug 2026 | $395K |
| Sep 2026 | $396K |
Comparables
Rent is compared per unit, which is the only fair basis across a house and a fourplex. The subject sits 1.4% above the median of its five closest comparables.
| Asset | Submarket | Proximity | Ask | Sq ft | $ / sq ft |
|---|---|---|---|---|---|
| LVN-03 Subject | Laveen | — | $396,000 | 1,780 | $222 |
| LVN-04 | Laveen | Same submarket | $372,000 | 1,622 | $229 |
| LVN-01 | Laveen | Same submarket | $431,000 | 2,185 | $197 |
| LVN-02 | Laveen | Same submarket | $458,000 | 2,640 | $173 |
| MRV-05 | Maryvale | Same city | $322,000 | 1,460 | $221 |
Sensitivity
What a five-percent move in price or fifty basis points on the rate does to the return. Computed at the baseline assumption set, not at whatever you have set the calculator to — it is a fixed reference.
Sensitivity — cash-on-cash by price and rate
Every other assumption held at the baseline set. A fixed reference, not tied to the calculator above. Estimates.
| Price \ Rate | 5.75% | 6.25% | 6.75% | 7.25% | 7.75% |
|---|---|---|---|---|---|
| $364,500−8% | -4.7% | -5.7% | -6.8% | -7.9% | -9.0% |
| $380,000−4% | -5.3% | -6.3% | -7.4% | -8.5% | -9.6% |
| $396,000ask | -5.8% | -6.9% | -8.0% | -9.1% | -10.2% |
| $412,000+4% | -6.3% | -7.4% | -8.5% | -9.6% | -10.7% |
| $427,500+8% | -6.8% | -7.9% | -8.9% | -10.0% | -11.1% |
Cash-on-cash-11.1% → -4.7%
What to check before you commit
HVAC replacement
The condenser dates to 2012 — 14 years old. Phoenix cooling loads shorten service life; a single-system replacement at current pricing is roughly $8,500. Reserve for it or price it into the offer.
Roof
Roof dates to 2012, 14 years old — inside the window most carriers will write without a surcharge.
Flood
FEMA Zone X. Outside the mapped special flood hazard area; a lender will not require separate flood coverage.
Water allocation
Served by City of Phoenix. Long-run Colorado River and Central Arizona Project allocation is a genuine risk to price on the metro’s growth edges over a 10-to-20 year hold. It is a discount-rate question, not a next-quarter question.
HOA
$88 a month, $1,056 a year, payable whether or not the unit is occupied. Read the CC&Rs for rental caps and minimum lease terms before you underwrite a lease-up.