Panel vintageSeptember 1, 202653 synthetic assetsDemonstration data — no real listings, no addresses
Parcel
Contact the desk

Tempe South

Supply-constrained infill; the city is effectively built out, so new supply is redevelopment only. The tightest standing inventory in the panel, and the thinnest yields.

Median ask
$468,000
Median rent
$2,260
Active inventory
87
Price YoY
2.2%
GRM
17.3
Panel assets
2
Median panel cap
3.28%

Against the metro

Both series are indexed to 100 at the start of the window, which is the only honest way to put two different price levels on one axis. A second y-scale would manufacture a correlation that is not in the data.

Tempe South vs metro — median asking-price index

Base 100 at the first month of the window. 24 monthly points.

  • Tempe South
  • Metro

Panel composition

2 of the 53 assets in the panel sit here: 2 single-family. Median asking price across them is $519,000, against a submarket median of $468,000.

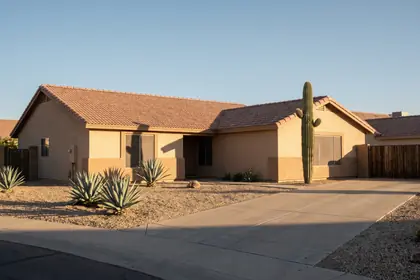
TMP-02

Tempe South · Tempe, AZ 85283

Single-family · 4 bd · 2 ba · 1,985 sq ft · 8,276 lot · built 1984

Asking
$542,000
Est. rent
$2,620/mo
Cap rate
3.35%
Cash-on-cash
-9.06%
DSCR
0.57
Rent / price
0.483%
Cash flow
-$1,125/mo
$ / sq ft
$273
Built
1984

Taxes $3,310/yr · Insurance $1,840/yr · No HOA · HVAC 2017 · Roof 2019
TMP-01

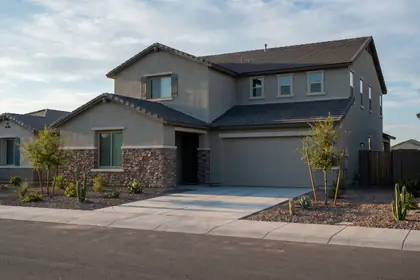
Tempe South · Tempe, AZ 85283

Single-family · 3 bd · 2 ba · 1,620 sq ft · 7,100 lot · built 1978

Asking
$496,000
Est. rent
$2,480/mo
Cap rate
3.20%
Cash-on-cash
-9.58%
DSCR
0.55
Rent / price
0.500%
Cash flow
-$1,089/mo
$ / sq ft
$306
Built
1978

Taxes $3,030/yr · Insurance $2,140/yr · No HOA · HVAC 2019 · Roof 2020

Open this submarket in the screener →

Submarket medians are synthetic demonstration data. Panel cap rates are estimates at the baseline assumption set. Not investment advice.